SensorThings Weather Station
Over the past few days I’ve managed to build a fully open source, standards compliant SensorThings public weather station:
- Find, buy and flash a fully open-source weather station and connect it to Home Assistant
- Send the Home Assistant sensor data to Confluent Cloud
- Setup a FROST SensorThings server
- Register the weather station in SensorThings
- Make a data product in Flink with cleaned up sensor data and publish to SensorThings
Sounds impressive but what can we actually do with this?
- Find out what sensors are registered
- Get information about sensors that are discovered through metadata (eg datasheets)
- Get Registered locations (lat, lon - WGS-84)
- Get sensor data, and ask for it to be paged/filtered
- … And lots more(!)
If your interested in a deep-dive, take a look at the docs from British Geological Survey for their test FROST instance. There’s some really good video tutorials and a bunch of real data as well.
In a nutshell, with a public server, anyone and anything can connect to your data and use it however they want, for any purpose - great!
For example, here’s some python to connect to my own service:
import requests
import pandas as pd
import matplotlib.pyplot as plt
# Base URL of your FROST server
BASE = "https://frost.declarativesystems.com/FROST-Server.MQTTP-2.6.2/v1.1"
# Datastream ID you want to plot
datastream_id = 4 # <-- replace with your real ID
# Fetch observations (you may need paging if many)
url = f"{BASE}/Datastreams({datastream_id})/Observations?$top=1000&$orderby=phenomenonTime asc"
resp = requests.get(url)
resp.raise_for_status()
data = resp.json()
# Extract relevant fields
obs = data["value"]
df = pd.DataFrame([
{
"time": o["phenomenonTime"],
"result": o["result"]
}
for o in obs
])
# Try to convert results to float — invalid ones become NaN
df["result"] = pd.to_numeric(df["result"], errors="coerce")
# Drop rows where conversion failed
df = df.dropna(subset=["result"])
# Convert time to datetime
df["time"] = pd.to_datetime(df["time"], utc=True, format="ISO8601")
# Plot
plt.plot(df["time"], df["result"], marker="o")
plt.xlabel("Time")
plt.ylabel("Value")
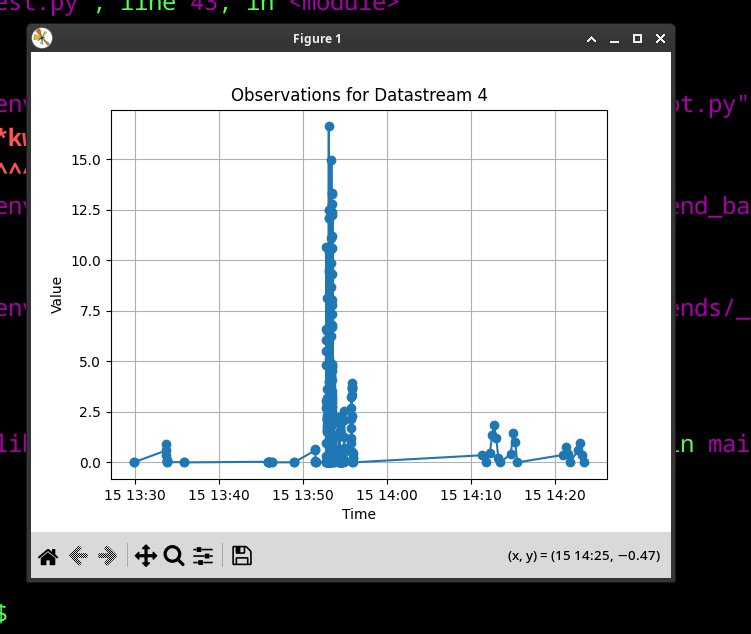
plt.title(f"Observations for Datastream {datastream_id}")
plt.grid(True)
plt.show()
Running this gives us a graph of historical wind speed in the living room (from spinning the anemometer):
Historical data is great - with what we already have, we could in theory graph whatever data was loaded into SensorThings. Loading historical data is also possible.
What’s missing from the approach above is live data. For this, FROST server supports MQTT, which is great, but we already have our live data in Confluent Cloud (Kafka), which is a much more scalable, enterprise friendly platform.
Hooking Kafka back into FROST and perhaps bundling a websocket server alongside MQTT would be a really fun project.
For the moment, the weather station is complete. I’ll leave the FROST server running for a while, have fun:
https://frost.declarativesystems.com/FROST-Server.MQTTP-2.6.2/
Update 2026
Since writing this blog post, I created a SensorThings integration for Home Assistant.
The integration sends observations directly from the Home Assistant server to SensorThings, without needing to use Kafka, Flink or Connectors, although you could totally still chose to do things that way if its useful. For an outdoor weather station in my living room, I couldn’t really justify the expense 😂.