Cost debugging JFrog Pipelines
Sometimes you get really high CI costs that are unexplained:
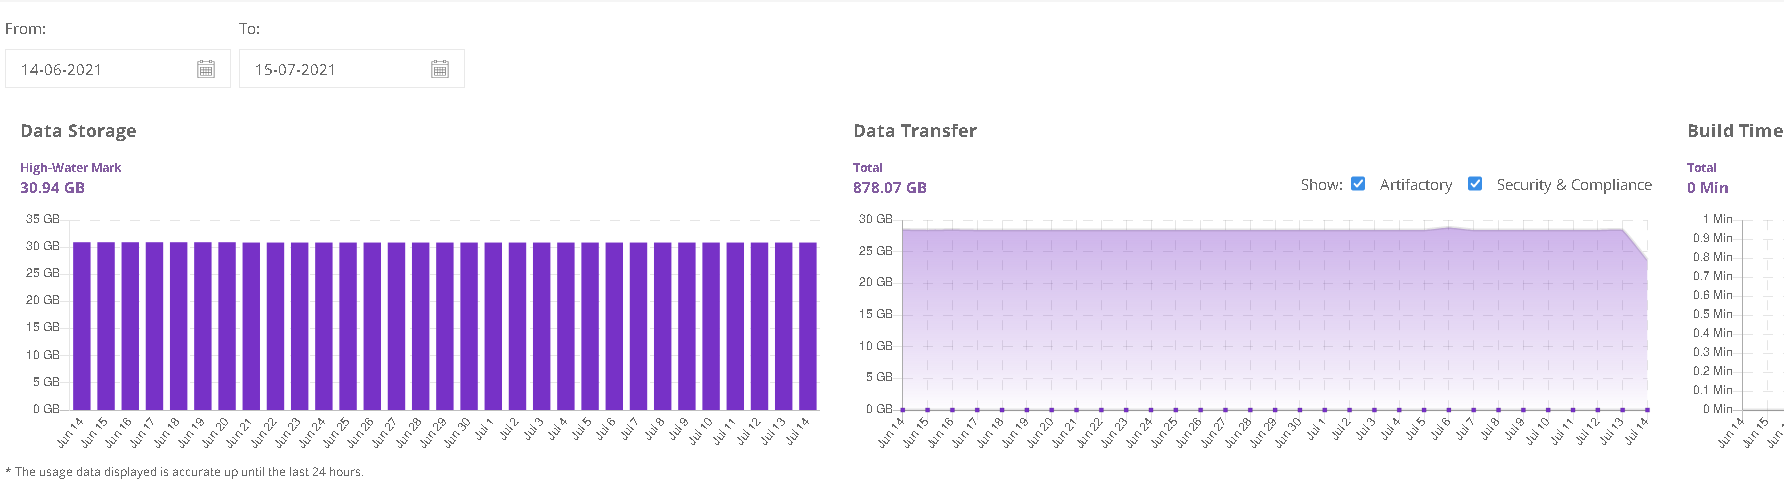
This graph is showing us we have consistently high downloads of about 30GB a day for a CI pipeline that isn’t actively running. This is data from JFrog cloud so we can use Artifactory Query Language (AQL) via Artifactory REST API
To debug what’s being downloaded, lets just grab a JSON file containing the artifact names and download stats from JFrog cloud:
curl -H "Content-Type: text/plain" -X POST -u${RT_USERNAME}:${RT_PASSWORD} \
  https://${JFROG_CLOUD_ID}.jfrog.io/artifactory/api/search/aql \
  --data 'items.find().include("name", "repo", "size", "path", "stat.downloads")' > download_stats.json
We can multiply size by stat.downloads to give the bytes downloaded and we
can make this figure human-readable by writing a
small script to output CSV data
Which we can then load into a google spreadsheet and do a side-by-side
comparison between two periods:
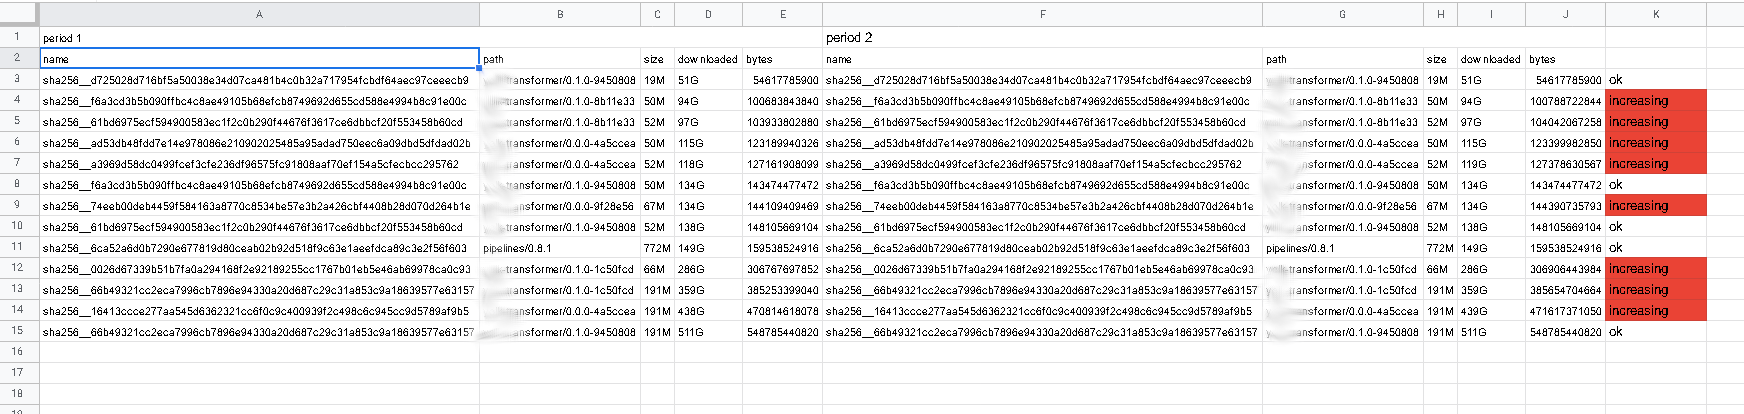
In this case we have a company with modern microservices hosted entirely on K8S
and the artifacts showing increases are all container images used by
K8S cronjobs
which currently run @hourly.
To resolve this we can look at a few quick fixes:
- Change cronjob frequency (eg to
@daily) - Make sure cronjob definitions set
imagePullPolicy: IfNotPresent - Experiment with AWS ECR to see if hosting the image in AWS as well as artifactory caches the image
- Reach out to AWS community/support and see if there are any other quick wins such as upgrading the kubernetes version